
Overview
The Global Green Growth Institute (GGGI) and KOICA, with the collaboration of Senti AI, have created this Climate Vulnerability and Risk Information System (CVRIS) in addition to other projects to support the transition of the Philippines in monitoring climate change, specifically for the agriculture sector.
From 2019, GGGI's intervention has been expanding towards structuring bankable projects and bringing climate finance to the country. It has strategically pivoted from pure adaptation to mitigation activities with an ambition of contributing to clean energy transition and creating new economic opportunities particularly for the poor and marginalized, for instance, by expanding agriculture value chain. Until 2025, GGGI will maintain its focus on structuring bankable projects as well as developing and/or strengthening policies that will provide an enabling environment for such investment in LGUs (Local Government Unit), which will end up contributing to Reduced GHG Emissions; Creation of Green Jobs; Increased Access to Sustainable Energy Services; and Enhanced Adaptation to Climate Change.
Risk Map
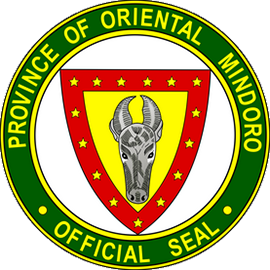
This page has a full-page map, a side panel and a collapsable floating panel.
Map Grid
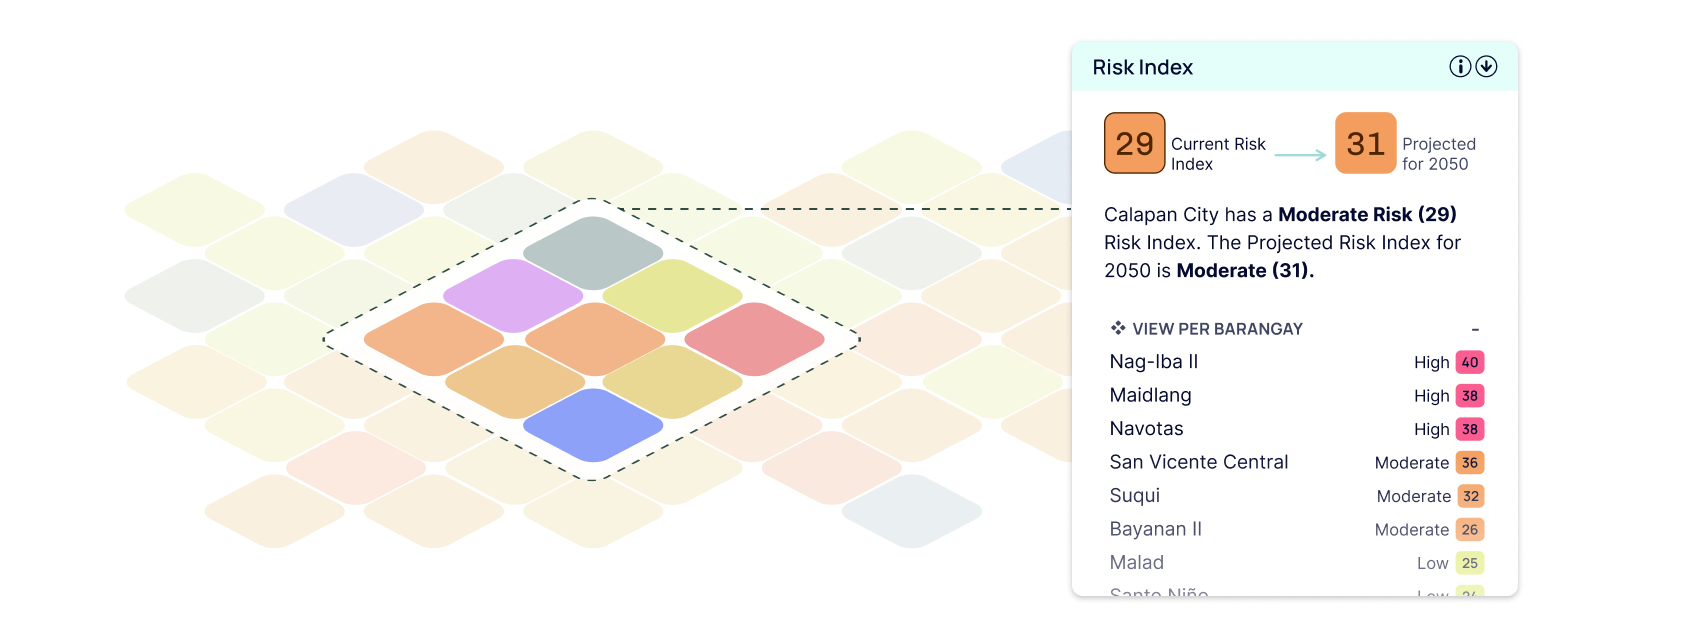
Shows a map of the risk scores. Each block on the grid map is 300m2.
When hovering over a block, relevant information will be displayed in a tooltip. You can zoom in and out on the map using the zoom buttons or the scroll wheel on your mouse. You can pan around the map by clicking and dragging. You can change the base map from vector (light) to Satellite. When filtered by LGU, the map will zoom and highlight selected LGU and show barangay borders.
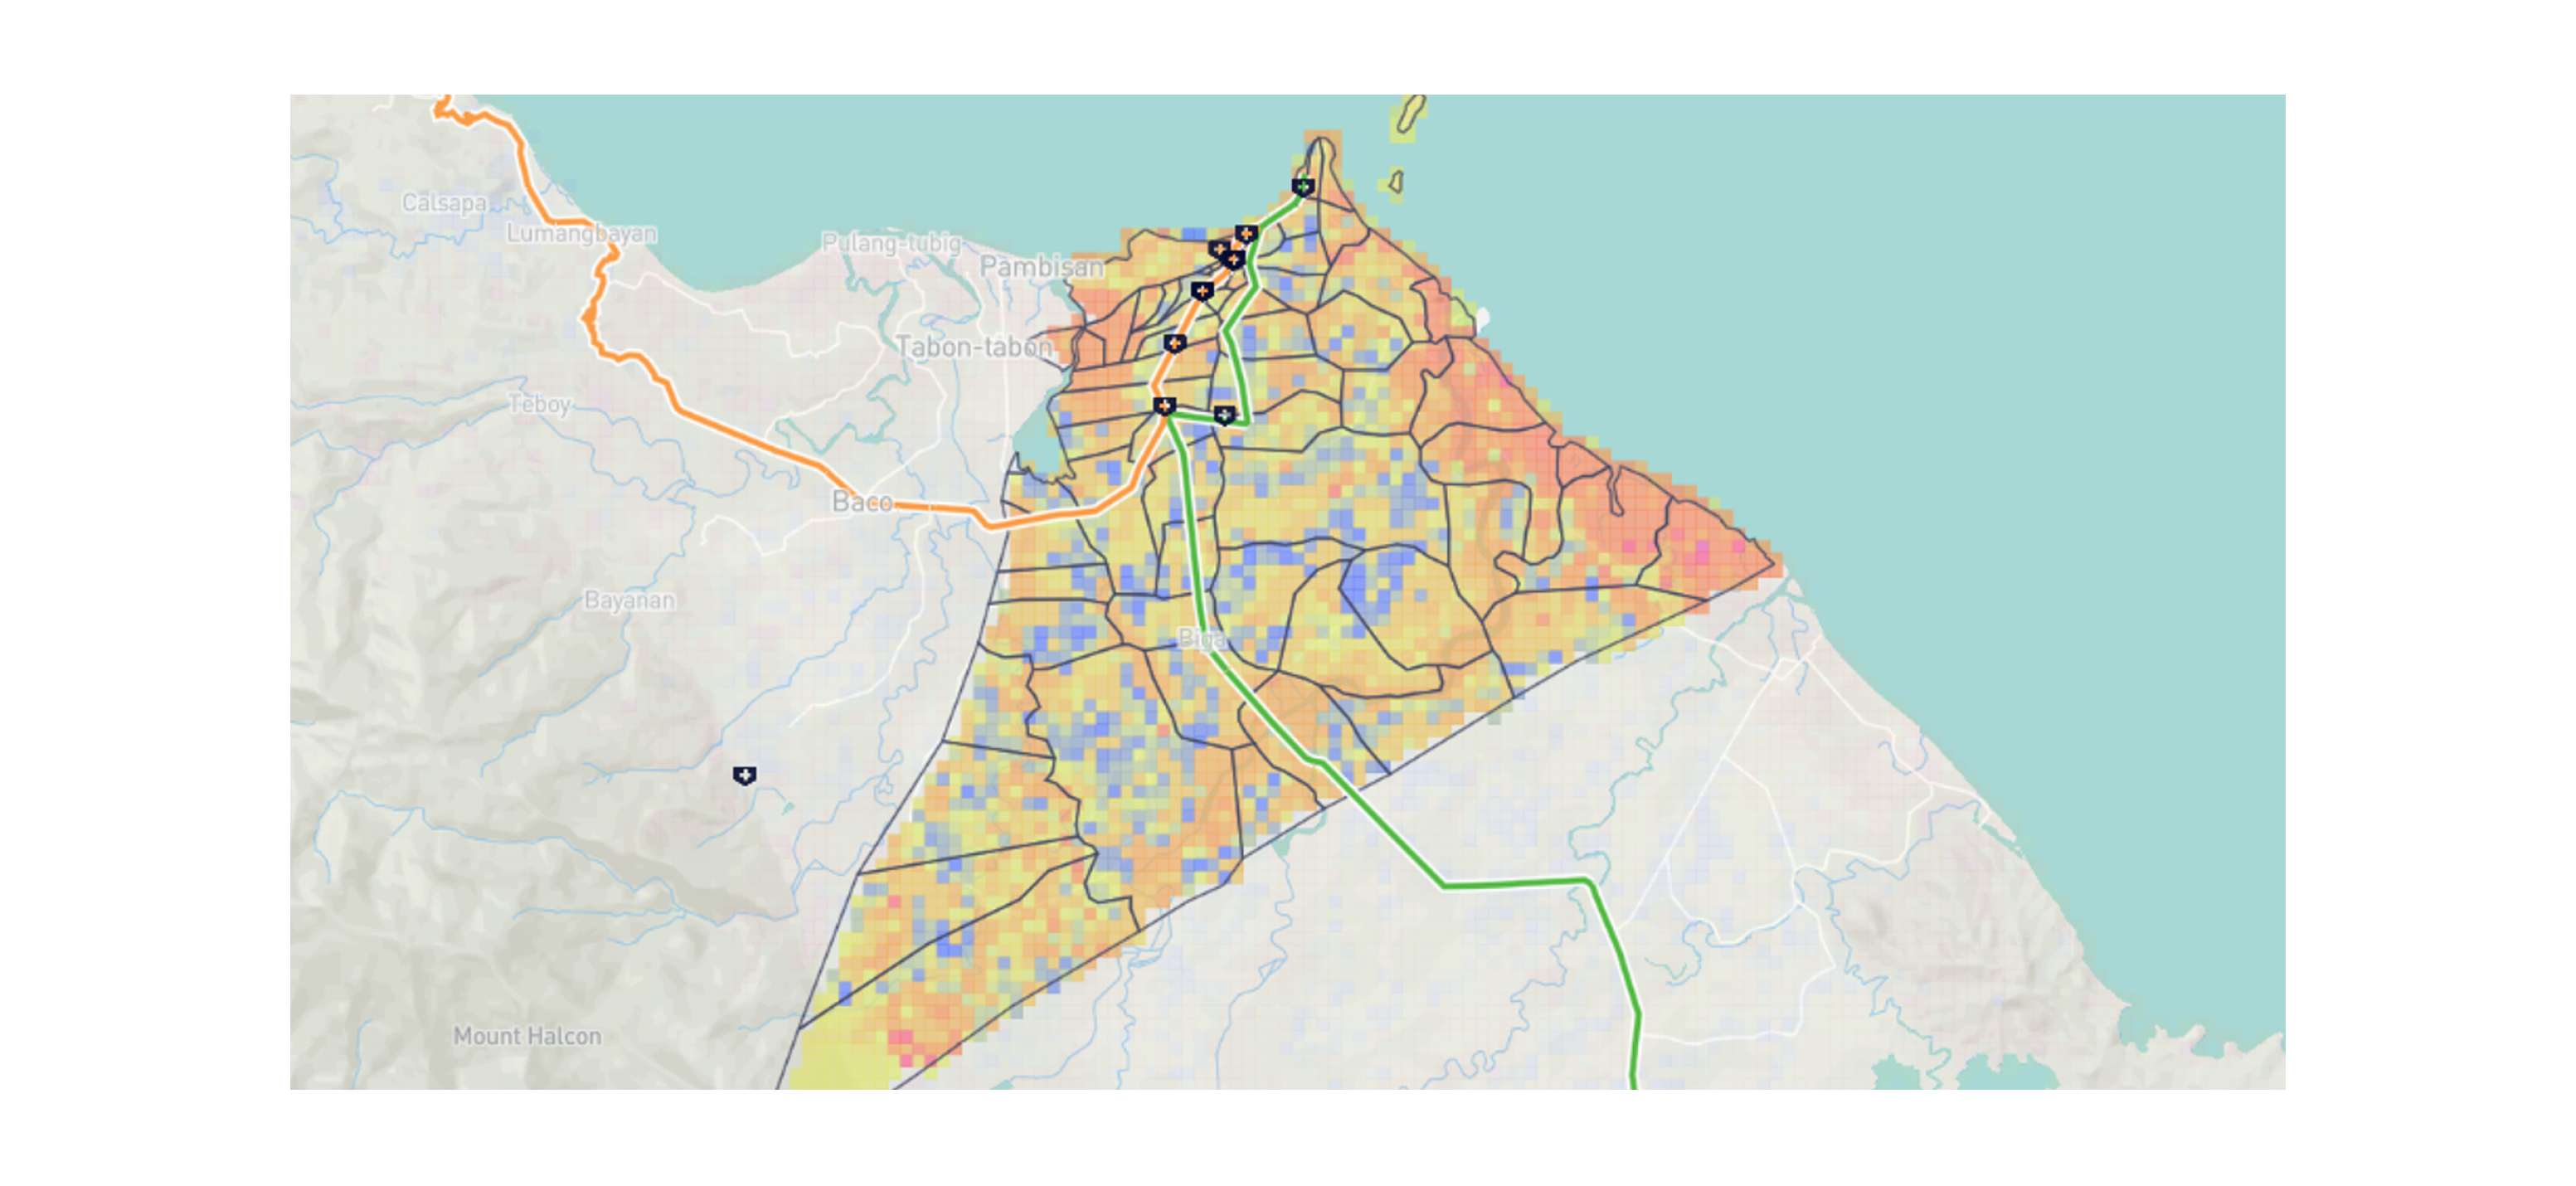
Clicking on a block will open a popover that will show you the breakdown of the risk index for that specific block. You can further see the breakdown per component by clicking on it.
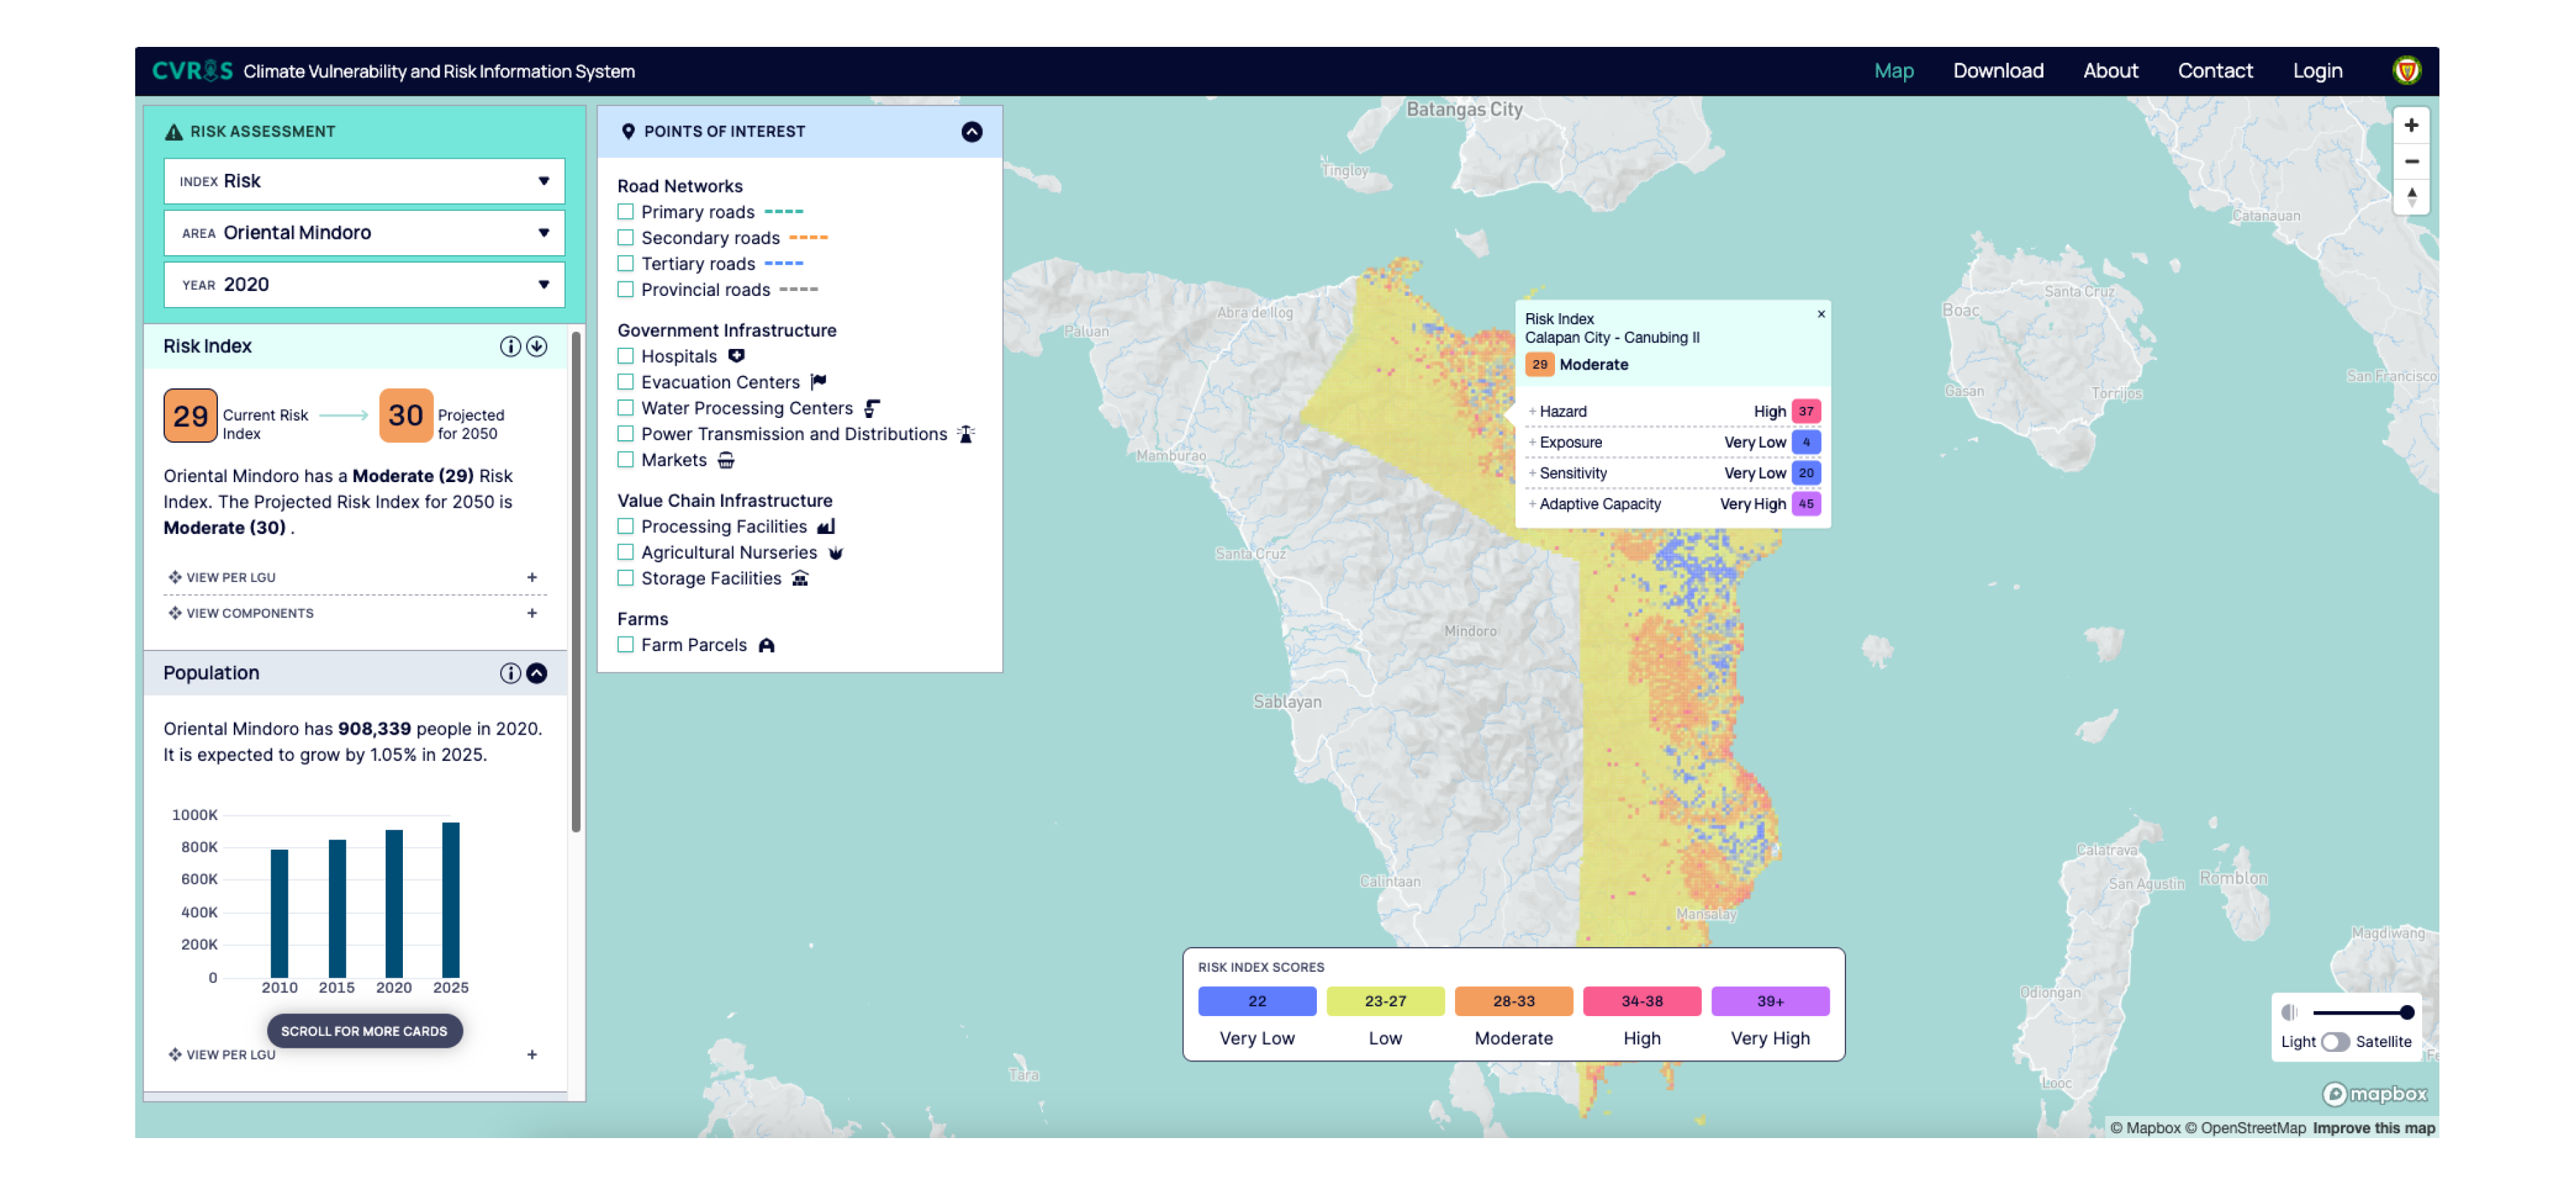
The scores are represented using a 5-step categorical color scheme from Very Low to Very High. The score scale is relative, meaning it's based on the available data, and the distribution frequency of the scores. Blocks in blue have very low risk RELATIVE to the rest of the province.

Hazard, Exposure, Sensitivity, and Adaptive Capacity Index scores are represented using 3-step sequential color schemes, with a single color at various intensities. In the map layers, darker shading indicates a higher contribution to overall risk.
Filters
The map can be filtered by Index (Risk, Components, or Sub-Themes), Area (LGU), and Year.
Changing the filters on the side panel will update the data displayed on the map and the side panel. When Oriental Mindoro is selected, the entire province is shown, and the ranking on the analysis card is based on LGU. When an LGU is selected, the map automatically zooms to the extent of the LGU, and the ranking on the analysis card is based on barangay. The barangay borders are based on the maps in https://gadm.org.

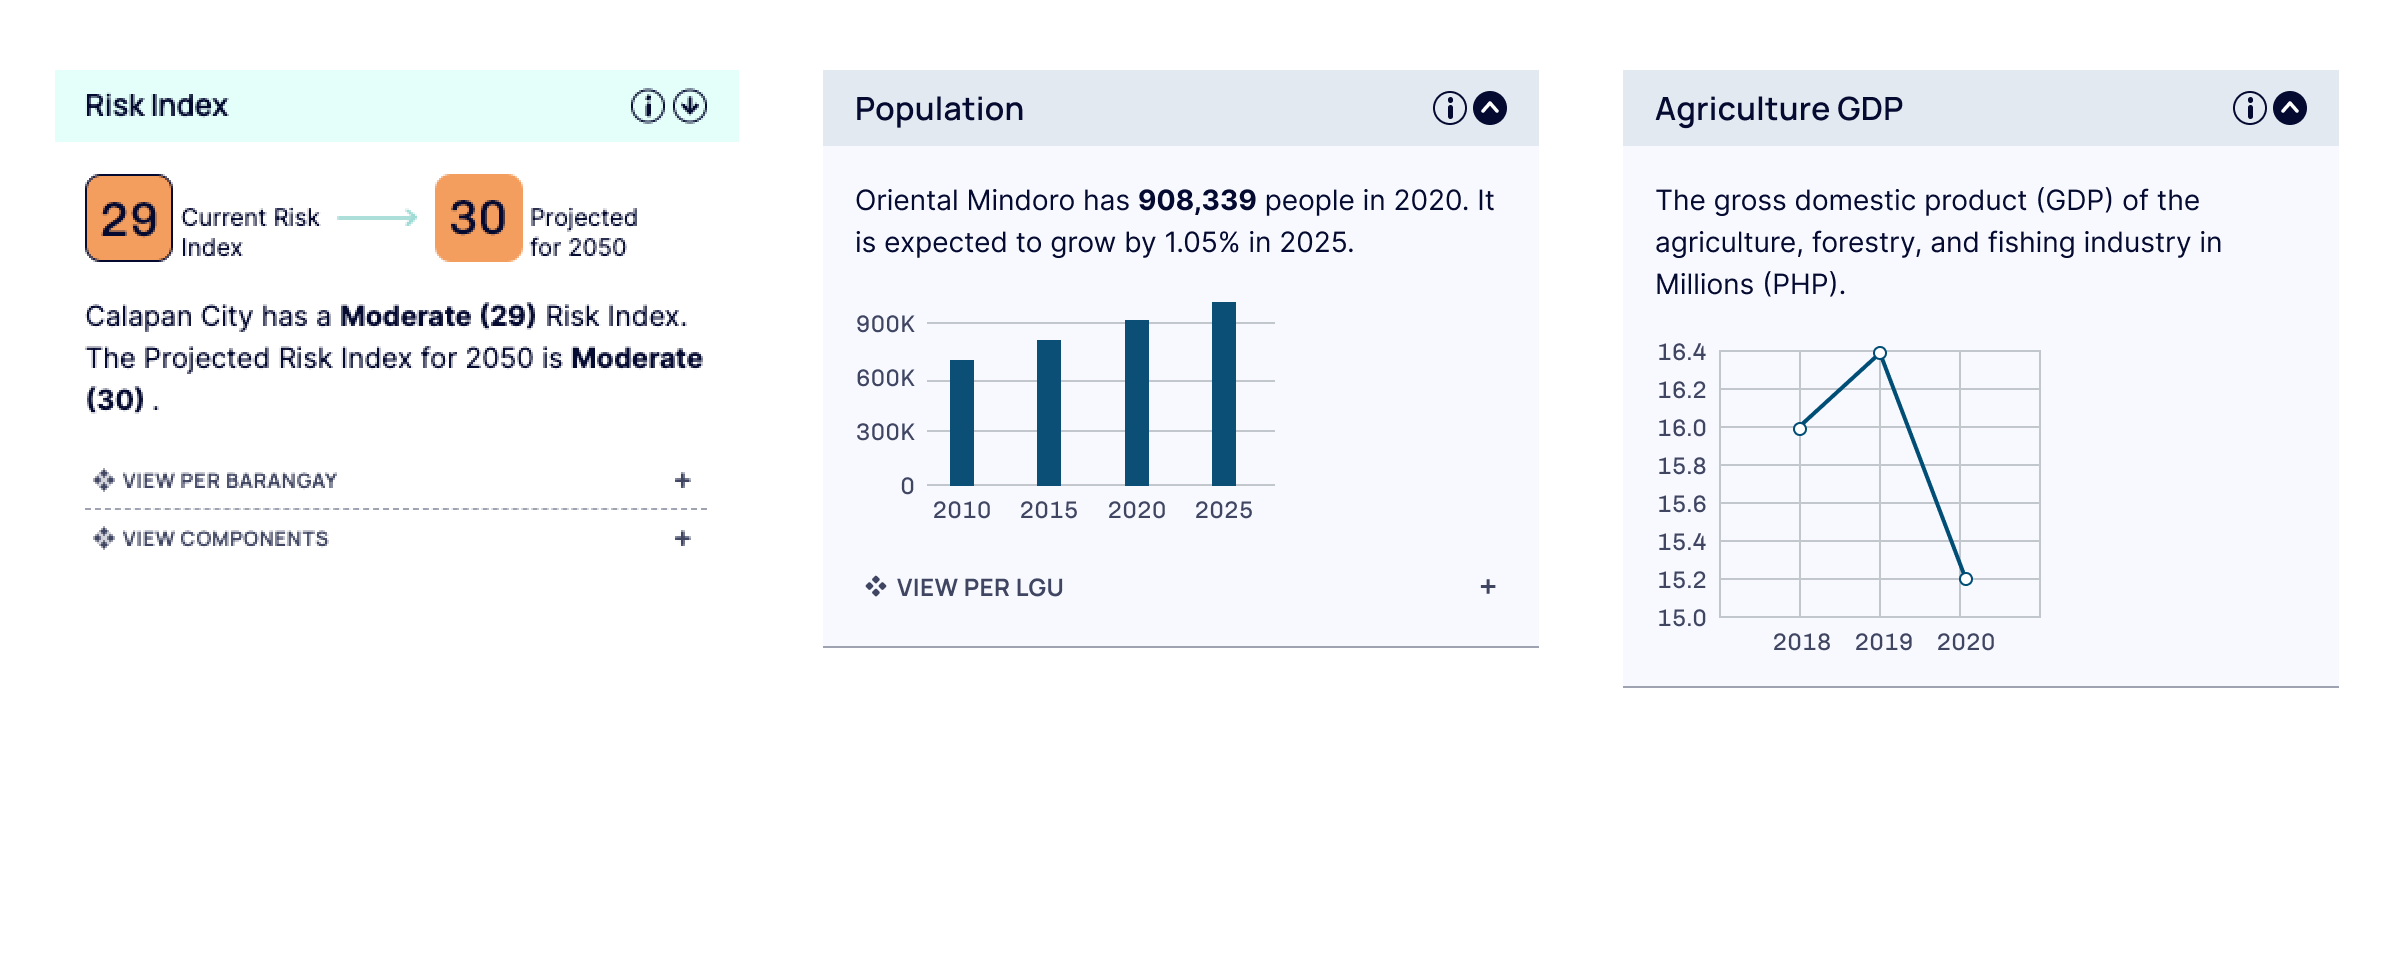
Analysis Cards
The side panel contains analysis cards on Risk Index, as well as supplementary province-level data on Population and Agriculture GDP, and POI cards. Most of these cards have a breakdown by LGU/barangay and Component/Theme based on the filters applied. You can scroll the side panel to see more cards. You can scroll the side panel to see more cards. Clicking the Info button will take you to a page with more information. Clicking the Download button will direct you to the relevant dataset on the Downloads page. The supplementary and POI cards can be collapsed to hide them.
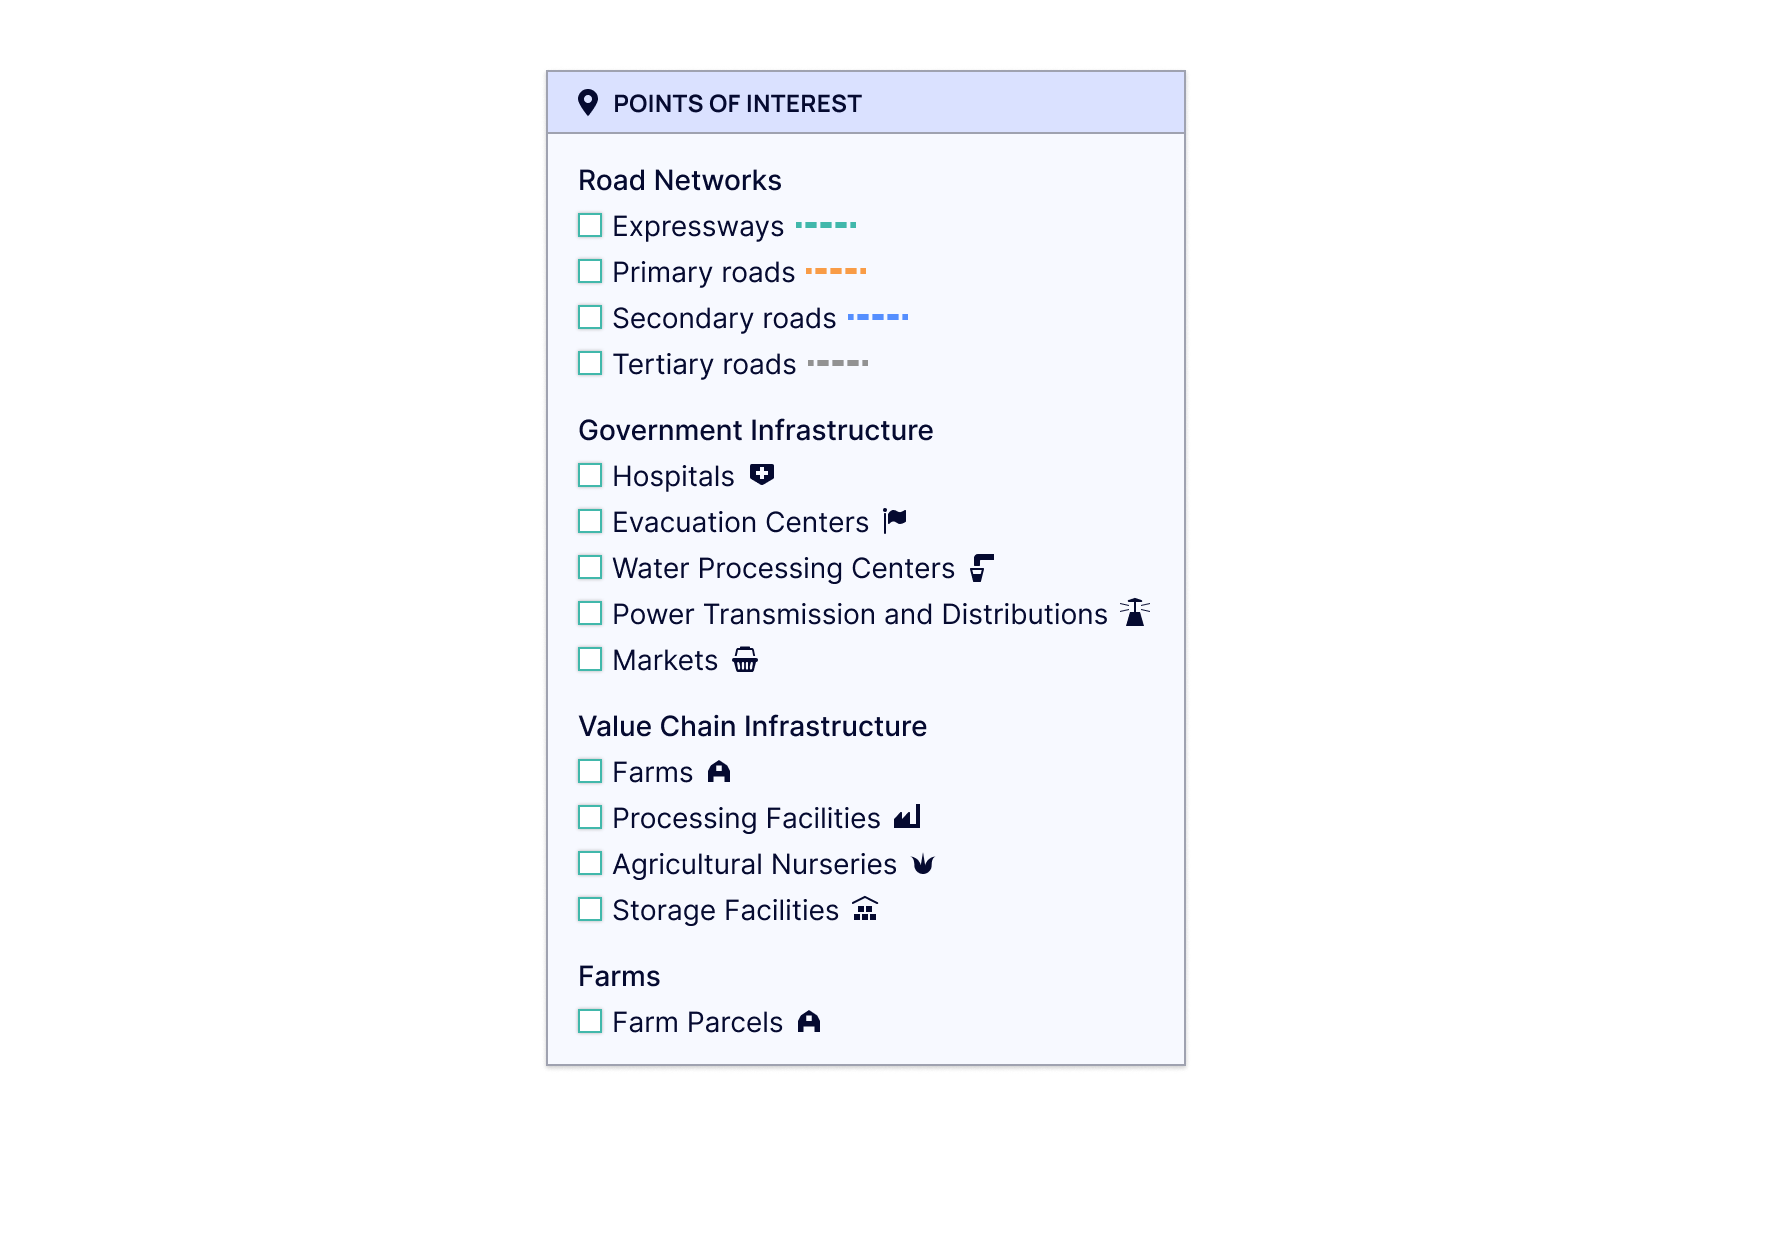
Points of Interests
The floating panel contains a list of paths and points that can be overlayed on the grid map. Each item has a legend that will appear on the map. Roads are represented as lines, Infrastructures are represented as icons. You can select multiple items on this list.
Toggling on a POI will also open a card on the sidebar that shows the total count of the POI.
Determining Risk
Risk Calculation
According to the Intergovernmental Panel on Climate Change (IPCC), Risk is the possibility of negative consequences under uncertain outcomes for something of value. It is the interplay of the general likelihood of hazardous events from occurring and the realized consequences if these occur.
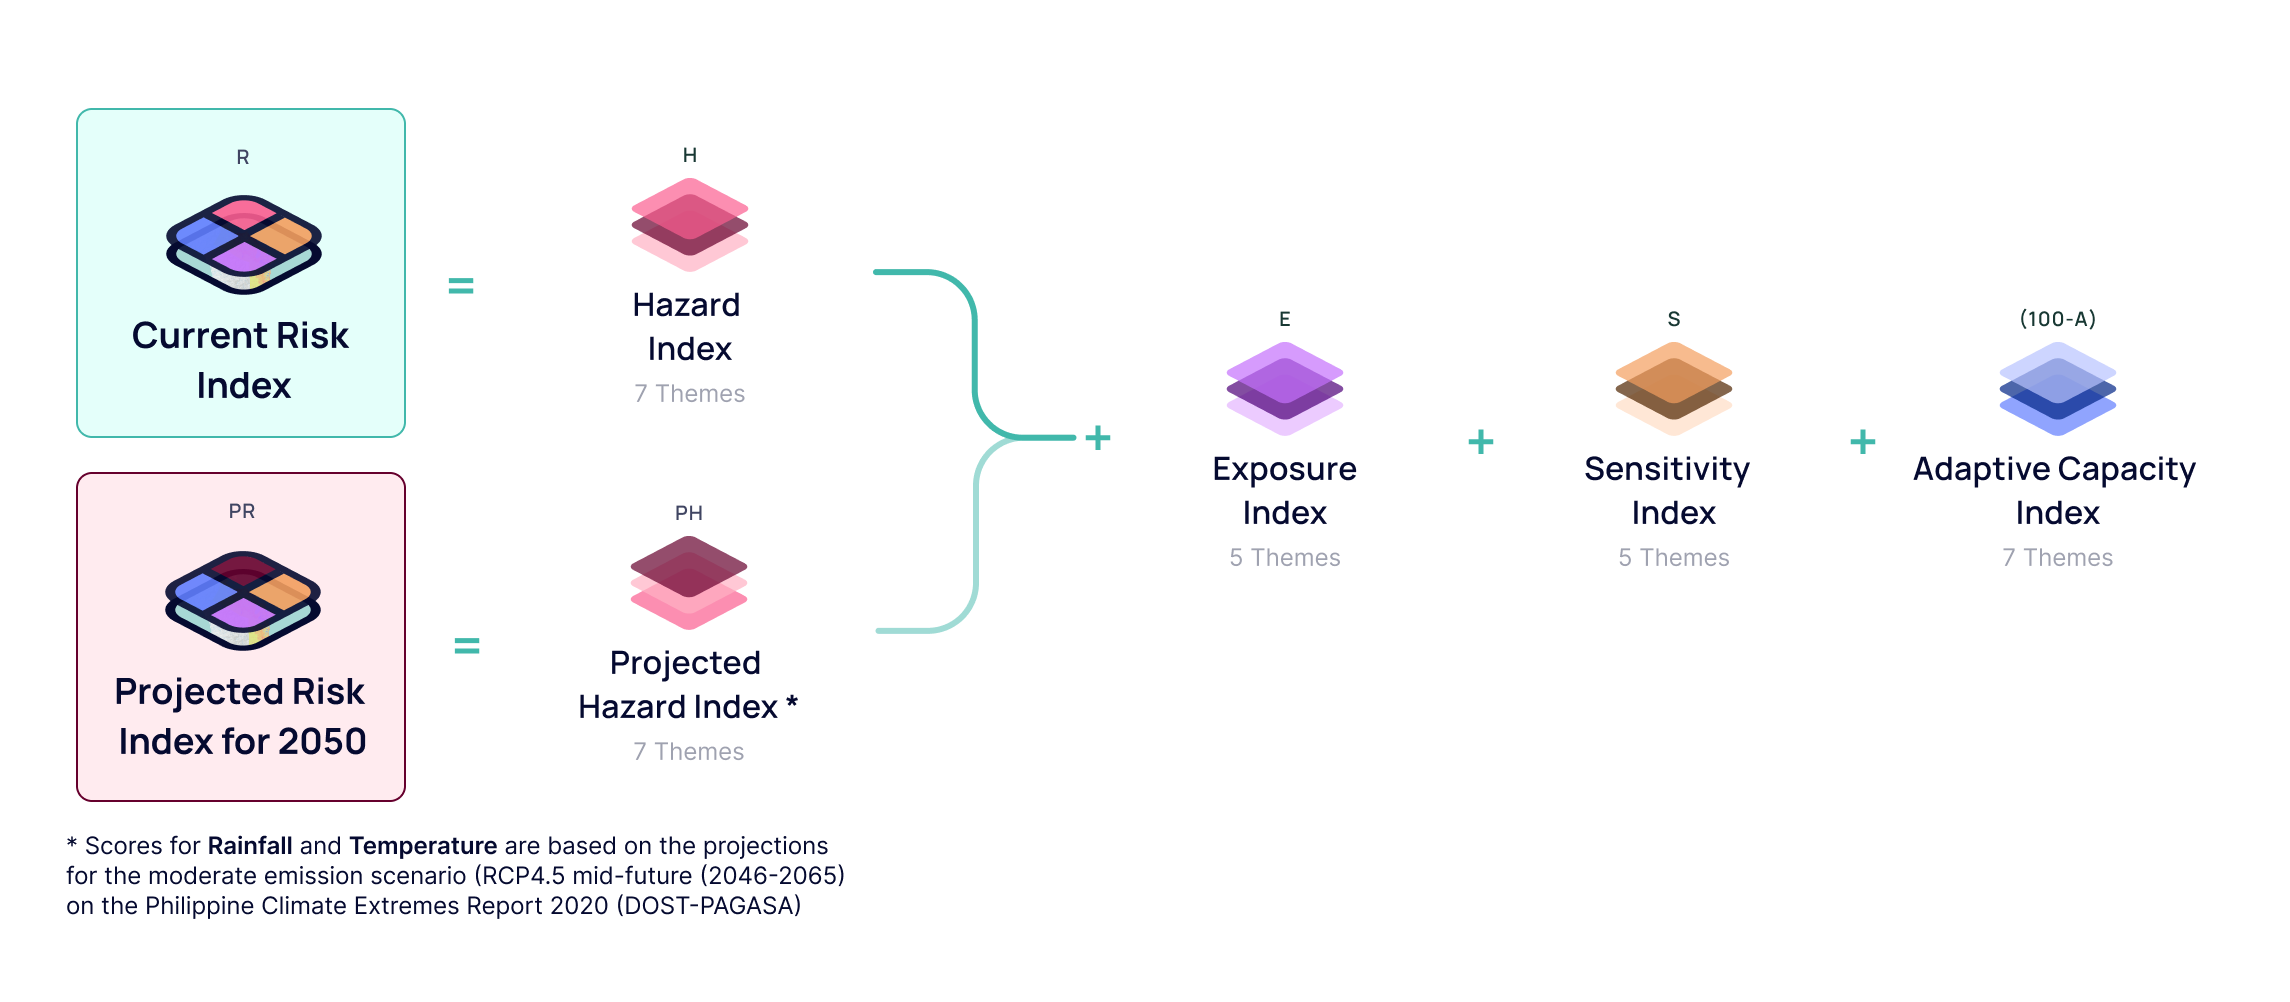
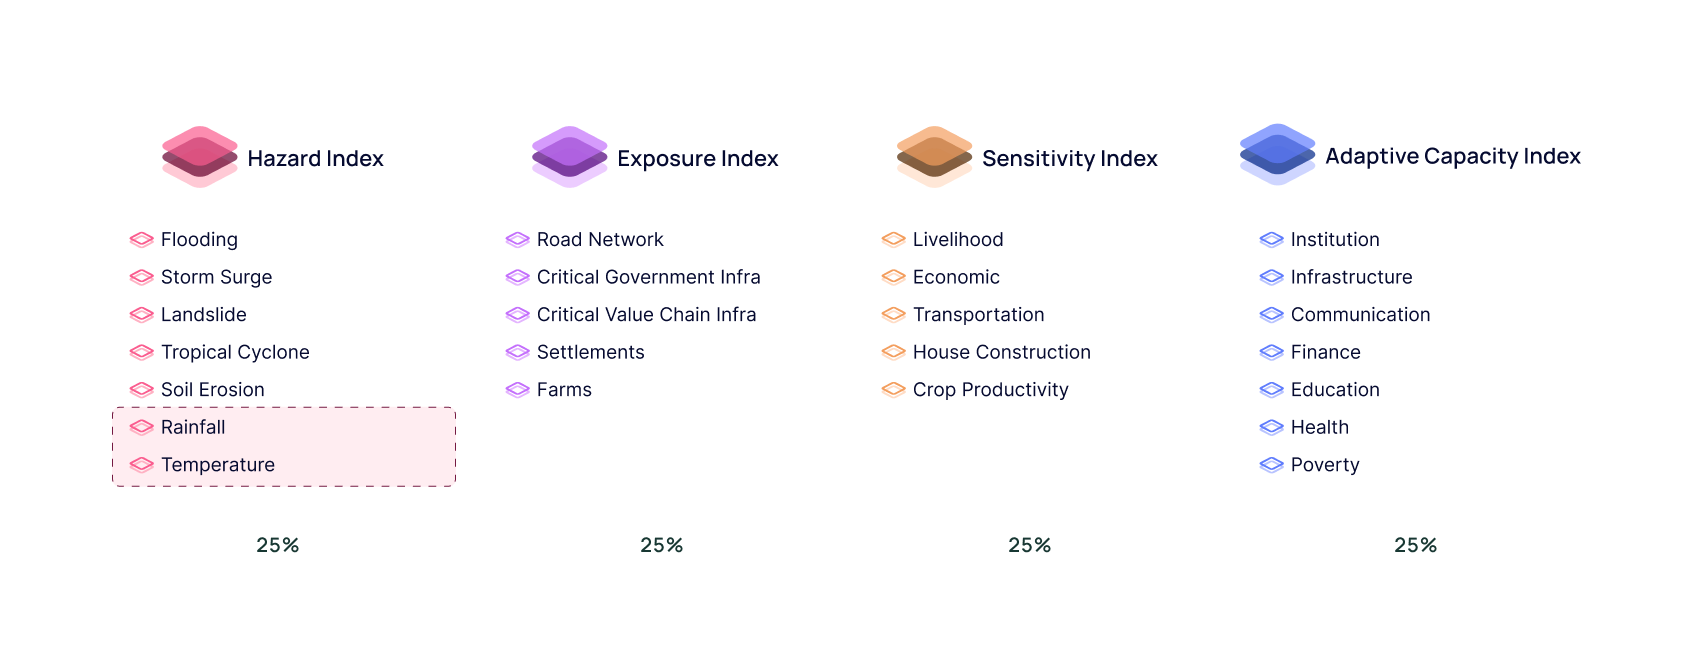
The CVRIS framework adopts the IPCC's definition of risk, as stated in their 4th and 5th annual reports. It encompasses four main components: hazard, exposure, sensitivity, and adaptive capacity. This framework takes into account both natural weather patterns and anthropogenic climate change as contributing factors to the hazards we face. It also considers socioeconomic pathways, mitigation, and adaptive strategies, and the availability of critical infrastructures and services. The adaptive capacity score is inversely proportional to an area’s risk— a higher adaptive capacity score results in a lower Risk Index score.
The data for the indicators are collected from national and sub-national agencies and government offices. The average scores of all indicators is computed per tile on the map grid. Each indicator data is standardized using a minimum-maximum normalization approach to create a score (Xn).
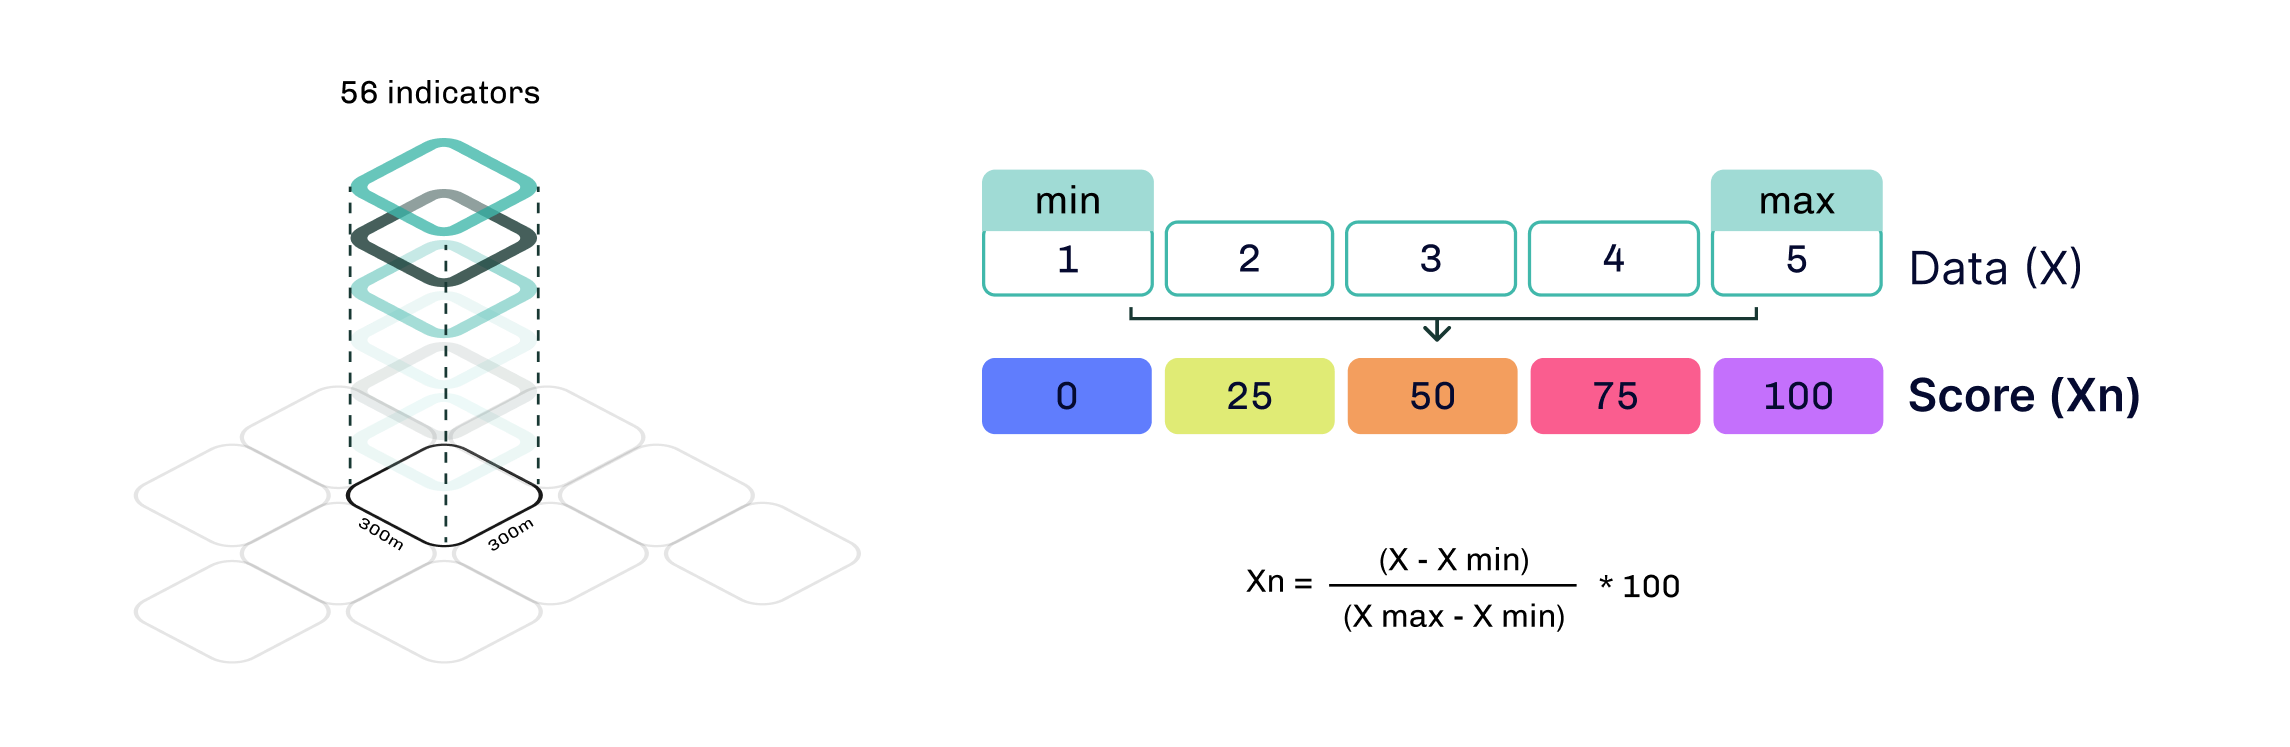
Component scores are computed by getting the weighted (by relevance) average of the indicators.
Composite Risk Index values are also calculated for each LGU (Local Government Unit) and barangay included in the Index based on the average scores within the area.
For future scenarios, the hazard index will be recalculated for the year 2050 based on downscaled climate projection values for Rainfall and Temperature indicators provided by the Philippine Climate Extremes Report 2020 (DOST-PAGASA et al., 2020). The new projected value of 'hazard' will then be combined with the exposure, sensitivity, and adaptive capacity indices of the selected location to calculate a new 'future risk' value for the year 2050.
Hazards
Hazard (H) refers to the occurrence of natural or human-induced events that may cause injury, loss of life, or other health impacts as well as damage and loss to property, infrastructure, livelihoods, service provision, and environmental resources. The Hazard Indicator score for each administrative shapefile or geographical unit will be the weighted average of all rescaled hazard scores computed using zonal statistics or raster calculator.
Flooding
Floods are one of the most frequent and costly natural disasters in the province of Oriental Mindoro. They are typically caused by typhoons and heavy or prolonged rainfall that saturate the ground over several hours or days. In addition, the province is also prone to flash floods, which occur when water rises rapidly along streams or in low-lying areas. Over the years, the province has experienced numerous flash floods, resulting in loss of life, damage to infrastructure, and agricultural losses.
Flood hazard maps provide information about the susceptibility of different areas to floods for various return periods. Oriental Mindoro experiences Type 1 and Type 3 climates, which means there are areas with distinct wet and dry seasons, as well as areas with less pronounced wet and dry seasons. Although some areas are protected by mountain ranges, the province is still vulnerable to heavy rains brought by the Habagat and tropical cyclones. As a result, flooding is frequent and causes significant damage to crops and the soil quality of farmlands.
Flood hazard maps for Oriental Mindoro are available from Project NOAH as raster files for 5-year, 25-year and 100-year return periods. Flood Hazard Maps for Puerto Galera and Roxas are not available.
| Indicator | Source |
|---|---|
| 5-year return period | Project NOAH |
| 25-year return period | Project NOAH |
| 100-year return period | Project NOAH |
Storm Surge
Storm surge hazard maps and inundation susceptibilities are generated using Japan Meteorological Agency storm surge model in simulating 721 tropical cyclones that entered the Philippine Area of Responsibility from 1951-2013. The storm surge risk index is the average of the four Storm Surge Advisory categories based on their peak height – SSA 1 (2.01m to 3m), SSA 2 (3.01m to 4m), SSA 3 (4.01m to 5m), and SSA 4 (5m and above).
Storm surge hazard maps are available from DOST-Project NOAH.
| Indicator | Source |
|---|---|
| SSA 1 (2.01m to 3m) | Project NOAH |
| SSA 2( 3.01m to 4m) | Project NOAH |
| SSA3 (4.01m to 5m) | Project NOAH |
| SSA 4 (5m and above) | Project NOAH |
Landslide
Landslides can be categorized as rain-induced landslides (RIL) or earthquake-induced landslides. In Oriental Mindoro, landslides are commonly triggered by heavy rains, especially in municipalities with upland communities. The province has a higher occurrence of RIL due to frequent typhoons and prolonged rainfall during the rainy seasons. Approximately 1,499 square kilometers, or about 34.34% of the province, are highly susceptible to landslides. Puerto Galera, San Teodoro, Baco, Bongabong, and Mansalay are the key municipalities identified. In addition to landslides, these areas also experience road slips.
Landslide hazard maps provide the susceptibility of areas to landslides and are available from DOST-Project NOAH.
| Indicator | Source |
|---|---|
| Landslide hazard map | Project NOAH |
Tropical Cyclone
Oriental Mindoro experiences Type 1 and Type 3 climates, which means there are areas with pronounced wet and dry seasons, and some areas with not so pronounced wet and dry seasons. Typhoons and the Habagat frequently pass the island, but not as much as the other provinces. Because of the significant number of upland farms in Oriental Mindoro, tropical cyclones are included as a sub-indicator. The tropical cyclone risk index is the average of the total typhoons that pass the island per typhoon signal levels.
Cyclone tracks are available from the International Best Track Archive for Climate Stewardship (IBTrACS v4) that is maintained by the National Climatic Data Center of NOAA.
| Indicator | Source |
|---|---|
| Total number of typhoons that hit (direct) by signal level (1-5) | NOAA |
Soil Erosion
Oriental Mindoro has a substantial number of upland farmlands in the municipalities of Victoria, Socorro and Pola that grow high-value crops and fruit trees. These areas experience soil erosion and road slips during heavy rains that affect their farmlands and the transport of their crop harvest. Soil maps describe the type of soil in a given area and can be used to estimate its susceptibility to soil erosion. Potential soil erosion susceptibility maps are created using the Universal Soil Loss Equation. It uses the soil map, land cover map, land elevation map, and monthly total rainfall as inputs.
| Indicator | Source |
|---|---|
| Soil type | Provincial Agriculture Office |
| Land cover | OCHA Philippines |
| Land elevation | PhilGIS |
| Annual Total Rainfall | Philippine Climate Extremes Report 2020 |
Rainfall
Oriental Mindoro experiences Type 1 and Type 3 climates, which means there are areas with pronounced wet and dry seasons, and some areas with not so pronounced wet and dry seasons. It is important to assess the frequency and amount of rainfall on rainfed farmlands. Frequent and large amounts of rainfall causes flooding but a good watering source for non-irrigated arable land. The total rainfall and its periodicity dictate the crop rotation system of farmers.
Indicator values are from the Philippine Climate Extremes Report 2020 (DOST-PAGASA et. al., 2020). Data is province level.
| Indicator | Source |
|---|---|
| Total wet-day rainfall | Philippine Climate Extremes Report 2020 |
| Average daily rainfall intensity | Philippine Climate Extremes Report 2020 |
| Maximum 1-day rainfall total | Philippine Climate Extremes Report 2020 |
| Maximum 5-day rainfall total | Philippine Climate Extremes Report 2020 |
| Rainfall on very wet days | Philippine Climate Extremes Report 2020 |
| Rainfall on extremely wet days | Philippine Climate Extremes Report 2020 |
Temperature
According to field study, different parts of Oriental Mindoro already have microclimatic conditions, and farmers have already recorded significant changes in average temperature over the years. Temperature changes can affect the productivity and quality of crops.
Indicator values are from the Philippine Climate Extremes Report 2020 (DOST-PAGASA et. al., 2020). Data is province level.
| Indicator | Source |
|---|---|
| Coldest Night time temperature | Philippine Climate Extremes Report 2020 |
| Average Night time temperature | Philippine Climate Extremes Report 2020 |
| Warmest Night time temperature | Philippine Climate Extremes Report 2020 |
| Coldest Day time temperature | Philippine Climate Extremes Report 2020 |
| Average Day time temperature | Philippine Climate Extremes Report 2020 |
| Warmest Day time temperature | Philippine Climate Extremes Report 2020 |
Exposure
Exposure (E) assesses the presence of people, livelihood, species, ecosystems, services, and infrastructure, socioeconomic and cultural assets in places and settings that could be adversely affected. Unlike the alternative exposure definition, this definition has an explicitly spatial dimension and refers to a location where lives and assets are potentially affected by a hazard.
Road Network
This includes road networks like Expressways, and Primary, Secondary, and Tertiary roads from OpenStreetMap.
A reliable road network is critical in maintaining the productivity of a crop's value chain (e.g. farm-to-market roads). They are also essential in assessing the connectivity of an area in cases of severe calamity. Losing access to critical infrastructure can trap and incapacitate poor farmer communities. A road segment is a stretch of street or road between two road intersections.
| Indicator | Source |
|---|---|
| Percentage of road segments per category exposed to hazards | OpenStreetMap |
Critical Government Infrastructure
This includes hospitals, evacuation centers, water processing centers, power transmissions and distributions, and markets from OpenStreetMap.
Having nearby hospitals that are left unexposed to disasters is critical in ensuring the health of poor households. Having access to nearby evacuation centers provides an important safety net for poor households. If households are in disaster-prone areas, it is more important that they have direct access to evacuation centers to help them prepare for recovery. Continuous access to water is crucial in surviving disasters. The robustness of the power grid can help ensure that everyone will still have access to electricity even during disasters. Markets are important actors and infrastructure in a crop's value chain. Having less exposed markets can ensure continuous economic activity.
| Indicator | Source |
|---|---|
| Number of exposed hospitals | OpenStreetMap |
| Number of exposed evacuation centers | OpenStreetMap |
| Number of exposed water processing and supply centres (groundwater wells, refilling centers) | OpenStreetMap |
| Number of exposed power transmission and distribution facilities | OpenStreetMap |
| Number of exposed markets | OpenStreetMap |
Critical Value Chain Infrastructure
This includes processing facilities, agricultural nurseries, and storage facilities from OpenStreetMap.
These facilities are critical to the value chain assessment of the crops. Farms are the source of the crops when planted, while the processing facilities, nurseries, and other storage facilities are where the harvested crops will be stored. These are facilities that are also exposed to the different identified hazards present in Oriental Mindoro. Processed products from the raw crops have more value and are also part of the initiatives of Oriental Mindoro to improve their agriculture sector.
| Indicator | Source |
|---|---|
| Number of exposed processing facilities | OpenStreetMap |
| Number of exposed agricultural nurseries | OpenStreetMap |
| Number of exposed storage facilities | OpenStreetMap |
Settlements
This includes residential areas from OpenStreetMap. Settlements are where farmers live. Knowing their exposure is a critical sub-indicator of the assessment.
| Indicator | Source |
|---|---|
| Number of households exposed to hazards | CBMS |
Farms
This includes farm areas from the RSBSA Registration of the Department of Agriculture. Identifying the total farmland areas exposed to disasters can estimate the amount of productive arable land that could be affected.
Only Bulalacao farms are included.
| Indicator | Source |
|---|---|
| Number of farms exposed to hazards | CBMS |
Sensitivity
Sensitivity (S) refers to the degree to which a system or species is affected (adversely in this case) by climate variability or change. The effect may be direct (e.g., a change in crop yield in response to a change in the mean, range, or variability of temperature) or indirect (e.g., damages caused by an increase in the frequency of coastal flooding due to sea level rise).
Livelihood
During a disaster, it is important to know how much of the total population will be affected in terms of agricultural output. It’s also important to know how many in each agricultural sector can be affected. Factors in the share of households engaged in agriculture, fishing, and livestock raising, as well as share of households with decreased harvest.
| Indicator | Source |
|---|---|
| Share of Households engaged in agriculture | CBMS |
| Share of Households in agriculture with decreased crop harvested (by crop) | CBMS |
| Share of Households in agriculture with decreased livestock raised | CBMS |
| Share of Households engaged in fishing | CBMS |
| Share of Households engaged in livestock raising | CBMS |
Economic
The combined gross domestic product (GDP) of the agriculture, forestry, and fishing industry for the whole province. It is also important to check how much of the province’s GDP may be impacted by sudden disturbances in agricultural output.
| Indicator | Source |
|---|---|
| Agricultural GDP | PGOM |
Transportation
Factors in the average distance of households from nearby roads. During a disaster, access to national roads and public transport allows households to evacuate to safer zones where they could wait and recover.
| Indicator | Source |
|---|---|
| Average distance of households from a nearby road | CBMS, OpenStreetMap |
House Construction
Factors in the proportion of houses made of weak materials. Materials used for home construction have different levels of endurance to different types of hazards and calamities. Houses and facilities with weaker materials would be easier to damage.
| Indicator | Source |
|---|---|
| Proportion of houses made of weak materials | CBMS |
Crop Productivity
Factors in the total output of rice, corn, coconut, banana, and seaweed. Different crops are affected depending on the area hit by disasters.
| Indicator | Source |
|---|---|
| Total output per crop | PGOM |
Adaptive Capacity
Adaptive capacity (A) is the ability of the system to cope with, absorb and moderate damages, and rebound from the consequences of climate change. This will result in a lower Risk index score, as the two are inversely proportional to each other.
Institution
Factors in the share of households with crop insurance and proportion of farmers with access to agricultural equipment.
Farmers who are members of the associations receive various support from the organization. However, those who are not members do not receive notifications or early warnings from the communication network of the association. Post-disaster support is also not easily accessible for those who are not members. Access to agricultural equipment like plows, hand tractors, and pesticide sprayers, can lead to production efficiency.
| Indicator | Source |
|---|---|
| Share of households with crop insurance | CBMS |
| Proportion of farmers with access to agricultural equipment | CBMS |
Infrastructure
Factors in the proportion of households with access to power (electricity) and sanitation (toilet).
Energy and power is needed to run certain tools and equipment for the maintenance of the farmlands. Having no access to electricity delays recovery efforts. Proper sanitation is important to ensure the health of the farmers and the environment.
| Indicator | Source |
|---|---|
| Proportion of households with access to electricity | CBMS |
| Proportion of households with access to toilet | CBMS |
Communication
Factors in the proportion of households with access to communication devices (possession).
Farmers rely on warnings from local government officials for incoming weather conditions and other important information. Having households with at least 1 communication device allows them access to these warnings. The cellular towers and strength of communication signals also affect the timely delivery and receipt of these warnings to ensure that farmers can make necessary preparations.
| Indicator | Source |
|---|---|
| Proportion of households with access to communication devices (possession) | CBMS |
Finance
Factors in the average amount of remittances received and share of people per income range.
Access to financial resources despite the lack of capital. Knowing this is essential to assess their capacity to continue their farming activities as part of their recovery.
| Indicator | Source |
|---|---|
| Average amount of remittances received | CBMS |
| Share of people per income range | CBMS |
Education
Factors in education completion rate (primary, secondary, tertiary) and literacy rate. Education is a critical determinant of an individual’s income and skills across the workforce.
| Indicator | Source |
|---|---|
| Primary completion rate | CBMS |
| Secondary completion rate | CBMS |
| Tertiary completion rate | CBMS |
| Literacy rate | CBMS |
Health
Factors in the average distance of households to the nearest health facility and proportion with access to clean water. Households with sickly members and are far from any healthcare facility are more vulnerable to future disasters.
| Indicator | Source |
|---|---|
| Average distance to nearest health facility | OpenStreetMap |
| Proportion of households with access to clean water | CBMS |
Poverty
Factors in the proportion of households with income below poverty threshold and proportion of farmers growing crops and livestock for personal consumption.
Although Oriental Mindoro has a relatively lower poverty incidence within MIMAROPA, poverty rate and extent of poverty are still important indicators to illustrate the vulnerability of the province to extreme weather events. Farmers may also plant crops for their personal consumption to avoid additional costs of purchasing from other sources. Having no other crop or livestock for food security increases their vulnerability.
| Indicator | Source |
|---|---|
| Proportion of households with income below poverty threshold | CBMS |
| Proportion of farmers growing crops and livestock for personal consumption | CBMS |
Terms of Use
The data made available through this Climate Vulnerability and Risk Information System (CVRIS) are provided for informational purposes. The Provincial Government of Oriental Mindoro does not warranty the completeness, accuracy, content, or fitness for any particular purpose or use of any public data set made available on Climate Vulnerability and Risk Information System (CVRIS), nor are any such warranties to be implied or inferred with respect to the public data sets furnished therein.
The findings, interpretations, and conclusions expressed in this event do not necessarily reflect the views of the Province and should not be reproduced or distributed without Provincial Government of Oriental Mindoro’s prior consent.
Contact Us
If you have any comments or feedback, do send in your suggestions in the form below.